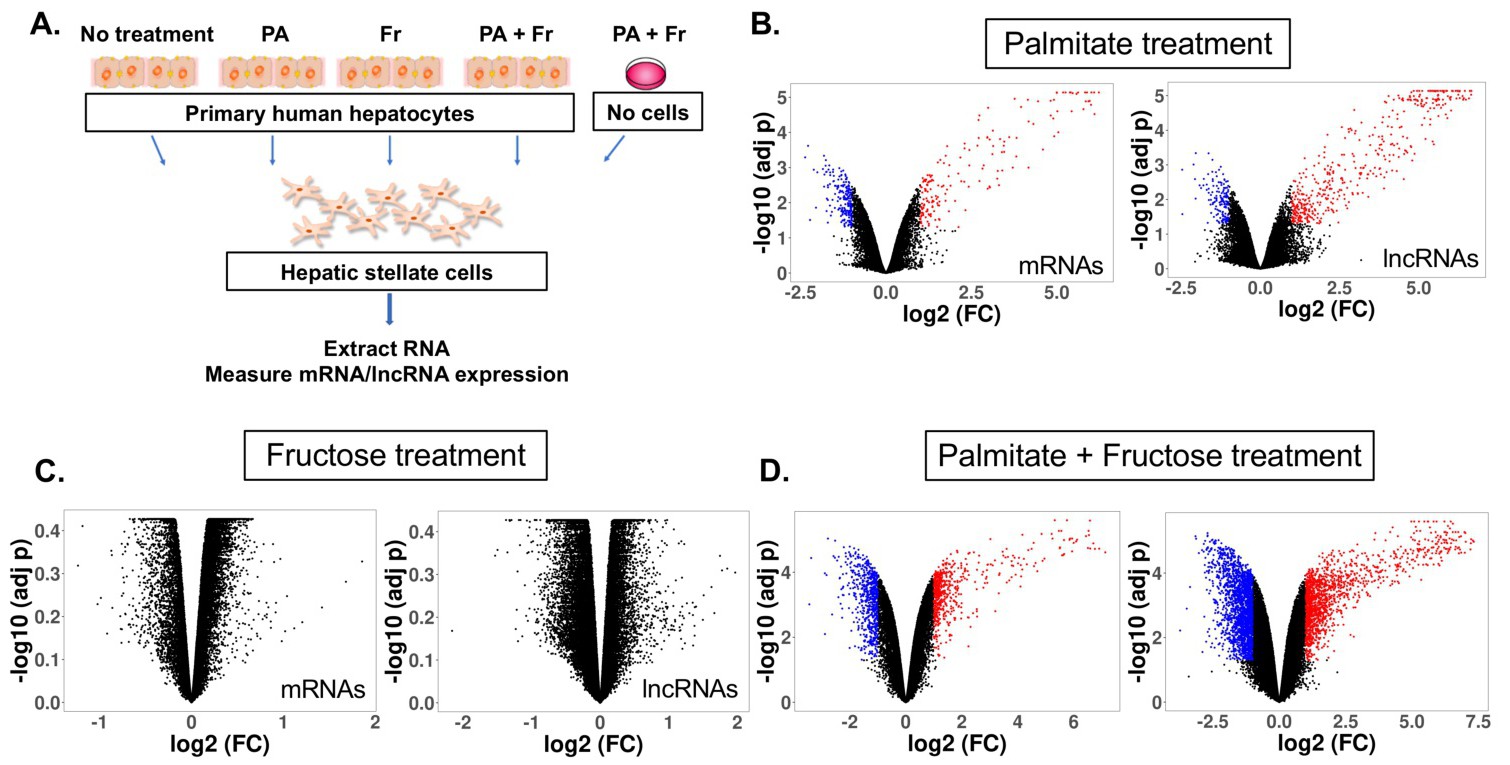
Fig. 1. Differentially expressed transcripts in HSCs exposed to conditioned media from treated hepatocytes. A) Overview of cell treatment strategy. Hepatocytes (PHHs) were treated with 1 mM palmitate, 10 mM fructose, or a combination of 1 mM palmitate and 10 mM fructose for 48 hours. LX-2 cells induced to achieve a quiescent phenotype [37] were then treated with hepatocyte-derived conditioned media for an additional 48 hours. Following stimulation with conditioned media, RNA was extracted from cells as described in the Methods section and quantitated using array hybridization. Volcano plots for HSCs exposed to conditioned media from hepatocytes treated with B) 1 mM palmitate, C) 10 mM fructose, or D) 1 mM palmitate + 10 mM fructose were performed to identify differentially expressed mRNAs and lncRNAs compared to the control treatment group. In the x-axis the is reported the log2 fold change, and in the y-axis the -log10(adj p). Data points in red represent significantly upregulated transcripts, while those in blue represent significantly downregulated transcripts (log2 fold change ³ |1|; adj p<0.05). Black-colored data points represent RNAs not showing statistically significant evidence for differential expression between treatment groups.